Sponsored by
the University of California Presidential Chair in Undergraduate Education and
the Roy Shlemon Chair in Applied Geosciences
INTRODUCTION
Background
The field of watershed science is inherently multidisciplinary, involving a broad array of physical, biological and social sciences. Traditional hierarchical undergraduate and graduate education programs that train students necessarily emphasize in-depth study within a specific discipline. This focused education is vital to producing professionals with useful technical and analytical skills. However, most students who pursue careers in watershed science and related fields rarely work solely within their discipline. Rather, their work is inevitably integrated with other professionals addressing related issues with different skill sets. The ability to work closely and collaboratively with professionals from different backgrounds is fundamental to success in this field.
This course introduces advanced undergraduate and graduate students to multidisciplinary study of stream ecology and geomorphology. The goal of this course is to bring students together from the fields of biology, ecology, geosciences and engineering to collaborate in addressing issues in river, stream and watershed management and restoration. The students form multidisciplinary research teams that evaluate existing information about a chosen watershed or issue. This is then followed by field studies in the watershed that address gaps in understanding or information. The hallmark of this course is its multidisciplinary nature and its hands-on, field-based approach. Each student comes to the course as an “expert” in his or her discipline. They are then required to teach the other team members the basic concepts and methods of their discipline, particularly field techniques. In this way, the students teach their peers, much as it will be in life after their university experience.
This is the second year that this course has been taught. To review the results of the first year’s course, which focused on juvenile salmonid habitat in the Copper River watershed of Alaska, go to: www.watersheds.edu/copper.
Research Question
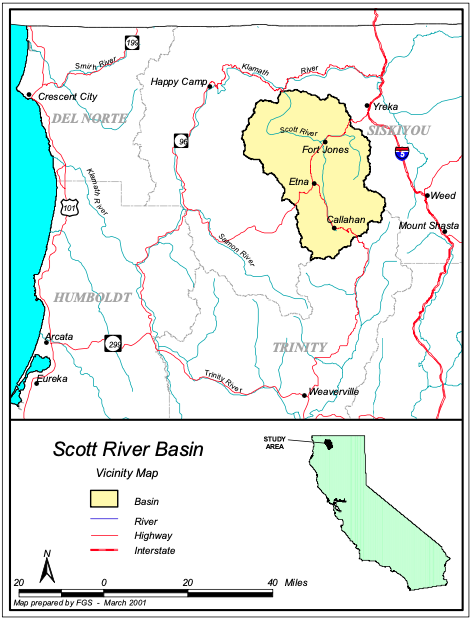
This report contains the results of this year’s stream ecology and geomorphology study. The focus of this year’s effort was on the Scott River of Siskiyou County in northern California—a tributary to the Klamath River (Figure 1).
The Klamath River watershed has been much in the news over the past two years. Water wars are nothing new in the American west, but the issues affecting the Klamath are particularly acute and complex. The interests of farmers, loggers, hydroelectric suppliers, commercial and sport fisheries, wildlife refuges, several large state and federal bureaucracies, and the multiple Native-American tribes that depend upon the Klamath system have all been impacted by the federal listing of the Lost River and Shortnose suckers in the upper watershed, and the state and federal listing of the coho salmon in the lower watershed (NRC, 2002). This year’s course examined one component of this controversy—limitations on coho and steelhead abundance within tributaries to the Scott River.
Recent reviews have demonstrated the significant decline of coho salmon in California over the past 40-50 years (CDFG, 2002). Many factors have contributed to this decline, including ocean conditions, fisheries, dams, water diversions, hatchery operations, and degradation of spawning and rearing habitat. Restoration of coho to large populations requires understanding and addressing all of these factors. The federal and state-listed Southern Oregon/Northern California Coast Coho Ecologically Significant Unit (SONCCC ESU) occurs within most tributaries of the middle and lower Klamath River watershed, below Iron Gate Dam. Within the Scott River watershed, coho are known to spawn and rear in tributaries to the mainstem Scott (CDFG, 2002). The quality of spawning and rearing habitat within these tributaries has been rated as fair to poor (CDFG, 1994, 2002). However, limited specific information exists about habitat conditions in the Scott River, and how these conditions may limit overall coho production.
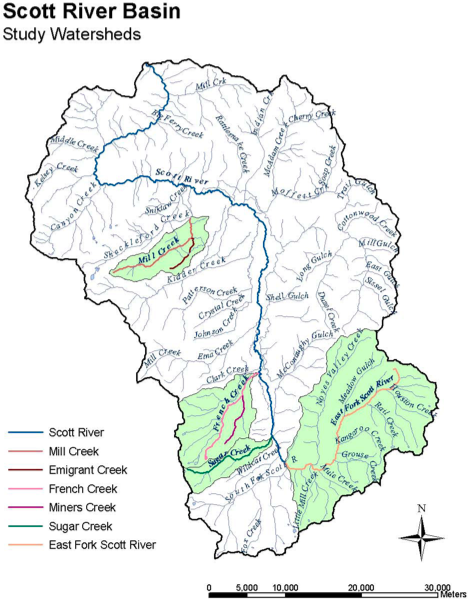
The students in this course focused their efforts on evaluating rearing conditions for salmonids in general, and for coho specifically, within four tributaries to the Scott River. From north to south, these include 1) Mill Creek and its tributary Emigrant Creek, 2) French Creek, 3) Sugar Creek, and 4) East Fork of the Scott River (Figure 2). As outlined below in the Methods section, emphasis was placed on the lower gradient reaches of these creeks where surveys have documented coho spawning over the past two years (Maurer, 2003). However, to provide an overall watershed context, reaches were surveyed or evaluated in the upper, steeper-gradient portions of the watershed as well. This effort also revealed some of the impacts of upper watershed land use on habitat quality in lower watershed sites. Surveys were conducted from June 16-25, 2003.
Important Caveats
It is important for readers of this report to note that this is a class exercise, not a scientific study of coho in the Scott River. Students conducted all of the work, including data gathering, synthesis and analysis. Because this was a training exercise for students from highly variable backgrounds, data and conclusions of this report should not be used as a precise measure of coho habitat suitability in the watershed. Moreover, this study was conducted during optimal conditions for coho following an unusually cool, wet spring in the Scott Valley. Unseasonably high flows and cool water temperatures persisted during the surveys. The greatest information about limiting factors associated with poor habitat quality are likely to come from surveys during the late summer/early fall, when high ambient air temperatures and reduced baseflow conditions persist.
METHODS
In an effort to evaluate stream conditions for rearing of juvenile coho salmon within the tributaries of the Scott River watershed, an integrative approach was employed that evaluated not only a wide range of small-scale site specific parameters, but also the larger- scale watershed context within which each study site lay. This type of spatial hierarchical analysis has been shown to provide a broader understanding of how processes and conditions at one spatial scale control and affect the processes and conditions at a smaller scale (Frissell et al, 1986; Imhof et al, 1996). For example, watershed-scale characteristics such as geologic rock type and vegetative cover directly affect the nature of reach-scale stream habitats, such as the amount of sand in pools and water temperature. Consequently, resource agencies have incorporated these concepts into their stream monitoring and evaluation programs in an attempt to better understand the impacts of land use and management activities on stream habitat conditions (Davis et al, 2001; Fitzpatrick et al, 1998; Lazorchak et al, 1998).
The methods utilized in this course combined techniques primarily from the U.S. Geological Survey’s National Water Quality Assessment Program (USGS NAWQA) (Fitzpatrick et al, 1998), the U.S. Forest Service’s Field Guide to Stream Channel Reference Sites (USFS) (Harrelson et al, 1994) and the Environmental Protection Agency’s Rapid Bioassessment Protocol (EPA RBP) (Barbour et al, 1999) with the specific intent of evaluating several factors that may limit coho rearing success. Those factors included stream habitat availability (channel structure and flow conditions), degree of in-stream sedimentation, water temperature, and relative abundance of food sources (macroinvertebrates). Although many other limiting factors exist for coho rearing success, time limitations associated with this class precluded further analysis.
Sample Reach Selection
Stream surveys were conducted in four tributary watersheds with a known history of coho spawning (Maurer, 2003), specifically, Mill and Emigrant creeks, French Creek, Sugar Creek and East Fork Scott River. Using GIS data provided by the California Spatial Information Library (http://gis.ca.gov/) each watershed was divided into two general sections based on topography, geology and vegetative cover type: an upper watershed dominated by steep slopes, bedrock geology and alpine plant communities, and a lower watershed primarily composed of shallower slopes, alluvial deposits and extensive riparian species. Within these two sections, stream segments were selected for more detailed field study based on landowner approved access. The one exception to this approach was Mill and Emigrant Creeks, where field study was limited to the lower portions of the creeks where access was granted.
For the field study portion of the class, students were divided into interdisciplinary teams of four people and assigned to a watershed. Each team consisted of a student with an academic background in geology, hydrology/engineering, fisheries and aquatic ecology, respectively. Once in the field, each team completed a reconnaissance of their selected stream segments to assess the overall character of the stream habitat and the diversity of the channel morphology. Each segment was classified into geomorphic reach types based on the classification of Montgomery and Buffington (1997). Portions of the stream segments were delineated as one of six reach types based on the dominant geomorphic processes exhibited: bedrock, cascade, step-pool, plane-bed, riffle-pool and dune-ripple. Once the range of reach types present in each segment was determined, each team identified representative sample reaches of a single reach type to survey in detail. Although the number of surveyed reaches varied by watershed, in general at least three different sample reaches were identified in the lower segments of each watershed. Details on the specific survey methods used to characterize each sample reach are described below. Due to time constraints, emphasis was placed on surveying sample reaches in the lower segments of the watershed where coho spawning has been documented. However, stream reconnaissance and reach characterizations were completed in the upper segments of each watershed, and if time allowed, representative sample reaches were identified and surveyed to provide a detailed comparison between habitat availability in the lower and upper watershed.
Sample Reach Surveys
In order to address the specific limiting factors for coho rearing described above, each representative sample reach was characterized using a variety of techniques selectively chosen from the diverse array of USFS, USGS and EPA RBP protocols. Specifically, sample reaches were characterized according to USGS NAWQA protocols (Fitzpatrick et al, 1998), habitat quality was assessed and macroinvertebrates were sampled following the EPA RBP approach (Barbour et al, 1999), channel morphology and substrate texture were surveyed in accordance to USFS Stream Channel Reference Site techniques (Harrelson et al, 1994), and relative fish abundance was determined by snorkel surveys. Standardized datasheets were used by each team in the field and are included in the appendices. Details on each survey technique and the associated datasheet are provided below.
Reach Characterization
Based on the ‘reach’ form used in the USGS NAWQA protocols, a ‘reach characterization’ datasheet was used to document the physical conditions and characteristics of the sample reach (refer to class website). The physical characterization included a description of stream origin and type, documentation of general land uses, indication of the presence or absence of erosional and depositional features, a summary of riparian and instream vegetation features and measurements of discharge and water quality. These data not only delineated the general condition of instream and riparian habitat, but helped to describe the factors influencing the biological condition of the stream.
In order to assess the overall quality of the physical in-stream habitat for biota such as fish and macroinvertebrates, we used the rapid qualitative assessment approach of EPA RBP. Various habitat parameters, such as substrate quality, extent of riparian vegetation, flow characteristics and habitat diversity among others, are evaluated and ranked on a scale of 0 to 20 for each sample reach. Scores increase as habitat quality increases. The habitat assessment forms differ slightly for high-gradient versus low-gradient reaches in order to reflect the coarser substrates inherent to high-gradient streams. Examples of each form are shown on the class website.
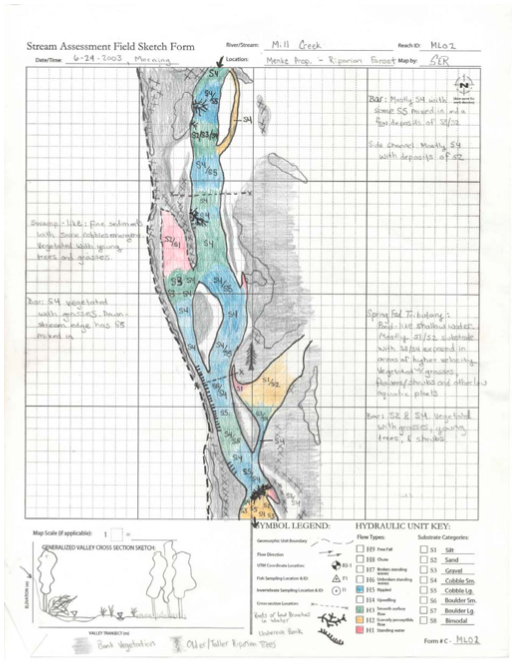
The data from the reach characterization and the habitat assessment were then compared between the four study streams to provide a general overview of the physical condition of each stream system. To document the site specific physical characteristics of each sample reach, the entire sample reach was hand sketched on a standard ‘reach sketch’ form (see class website). Although not to scale, the reach sketch provides a snapshot of the current condition and character of the sample reach. Specific details such as log jams, pieces of large woody debris, extent of riparian vegetation, and proximity of pools to undercut banks among others can be documented and later referred to as conditions within the reach change.
Geomorphic Survey Techniques
The geomorphic characteristics of each sample reach were evaluated using the USFS protocols described by Harrelson et al (1994) and recorded on newly created datasheets in order to standardize data collection (see class website for examples). Two cross-section profiles were surveyed in the two most dominant habitat types found within the sample reach. For example, if a sample reach was predominantly riffles and pools, then one cross-section would be surveyed in a representative riffle and one in a representative pool. Data was recorded on the ‘Channel Morphology Survey Datasheet’ specific to Cross-section Profiles (see class website). A longitudinal profile of the channel bed and water surface through the full length of the sample reach was also surveyed and recorded on a form similar to the cross- sections. Sediment conditions were recorded on the ‘Sediment Characterization Datasheet’, and included an assessment of the sediment quality, the percent and type of organic material and the distribution of sizes of inorganic material. To determine the grain size distribution through the reach, a Wolman-style pebble count was completed at each cross-section. From this data, D16 (i.e. 16% of the total sediment sizes are finer than the D16 grain size; representative of the fine sediment fraction), D50 (median grain size) and D84 (representative of the channel bed roughness) were calculated to provide a more complete picture of the range of sediment sizes deposited throughout the reach.
Macroinvertebrate Survey Techniques
Benthic macroinvertebrates were sampled following the EPA RBP protocols for a single habitat (Ch.7, Barbour et al, 1999). Samples were focused in riffles or runs where macroinvertebrate abundance and diversity is usually highest due to the prevalence of coarse substrate material. A D-frame dipnet was used to collect three sub-samples in three riffles or runs throughout the reach. One kick was completed for 90 seconds at each sub-sample site, and samples were preserved in ethyl alcohol for post-processing following the field effort. Data was recorded on a newly created ‘Macroinvertebrate Survey Datasheet’ that included information collected in the field (such as local velocity, depth and temperature at the kick site) and information collected during the post-processing of samples. Sub-sample locations were also delineated on the reach sketch form for that sample reach. Post-processing involved sorting the macroinvertebrates and identifying individuals to order and genus. An example datasheet is shown on the class website.
Fish Survey Techniques
Relative fish abundance and diversity in each sample reach was qualitatively evaluated using a snorkel survey of the entire reach length. One or two snorklers would float the reach calling out numbers and approximate size classes of fish observed to a data recorder on the bank. Species, count data, condition and any information on habitat were recorded on the ‘Fish Survey Datasheet’ (see class website). Surveys ranged in time from one to several hours depending on the length and habitat complexity within the reach. In some cases, locations of large numbers of fish were delineated on the reach sketch form in order to document the spatial distribution of fish relative to habitat type throughout the sample reach.
In addition to the snorkel surveys, one sample reach on each study creek was electro- fished in partnership with California Fish and Game biologists. The electro-fishing effort, although only completed in one sample reach, provided a good validation of the species diversity observed during the snorkel surveys, as well as an opportunity to record individual fork lengths, and thus determine the relative size distribution of different fish species. When graphed, the size data provide a quantitative evaluation of the age classes of each species present within the creek.
Survey Data
The raw data collected within each study watershed is included in the Appendices. Each Appendix is associated with one study watershed, and includes the following data for each survey reach in order: pictures taken in the field, electronic copies of the reach characterization, habitat assessment and reach sketch forms, plots of the cross-section and longitudinal profiles, and graphs of the surface grain size distribution. The raw data for the fish and macroinvertebrate surveys are provided in excel files available both on the final report CD and on the class website.
MILL AND EMIGRANT CREEK
Introduction
Mill creek and one of its tributaries, Emigrant creek, drains the eastern slopes of the Marble Mountains Wilderness Area (Figure 2). Together the streams flow through the Quartz Valley and join Shackleford Creek before draining into the Scott River north of the Quartz Mountains. These creeks differ from one another in that they are very dynamic in response to changing climate, geology, and anthropomorphic conditions. Both creeks showed considerable ability to provide rearing habitat for juvenile salmonids.
Watershed Characteristics
The northeast-facing Mill/Emigrant watershed covers 51.0 square kilometers of the west side of the Scott valley. Mill Creek is the primary tributary to Shackleford creek and Shackleford creek is a tributary to the Scott River. Emigrant Creek is a tributary to Mill Creek, and the confluence of the two lies roughly 3km south of the Shackleford confluence (Figure 2). A summary of various watershed characteristics is shown in Table 1.
| Watershed Characteristics | Mill/Emigrant Creek |
| Watershed Area (km2) | 51.013 |
| Watershed Perimeter (km) | 37.248 |
| Watershed Aspect | northeast |
| Watershed Elevational Range (m) | 855 to 2129 |
| Stream Elevational Range- Mill (m) | 855 to 1974 |
| Stream Elevational Range- Emigrant (m) | 884 to 1245 |
| River Distance on Scott (km) | 40 |
| Stream Order- Mill | 3 |
| Stream Order- Emigrant | 2 |
| Stream Length- Mill (km) | 15.l |
| Stream Length- Emigrant (km) | 5.2 |
| Length of all Streams in Wtrshd (km) | 41.2 |
| Drainage Density (km per km2) | 0.81 |
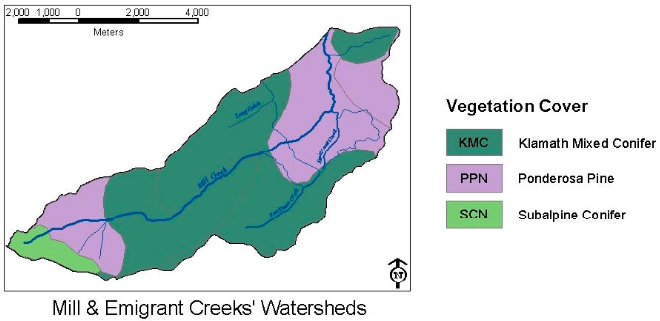
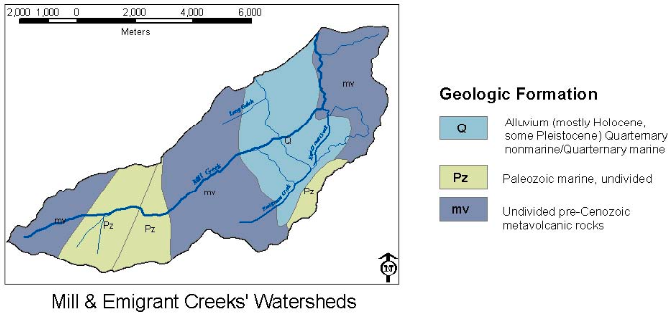
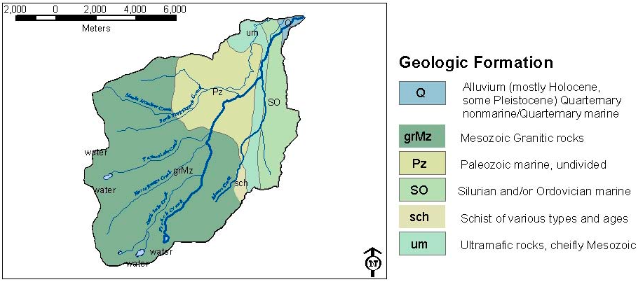
The majority of Mill Creek is under private ownership and management except for the headwaters, which are largely in the Marble Mountain Wilderness Area (under USFS management). In the upper Mill watershed, the dominant vegetation type is mixed conifer, consisting of ponderosa pines, white fir, cedar, and other subalpine conifers. Presumably, historical logging took place on the National Forest land; however, due to limited time and access, a field visit to the upper reaches of the watershed was forgone and the status of logging and its impacts on Mill Creek were not observed. Figures 3 and 4 show specific vegetation cover and geology types throughout the watershed.
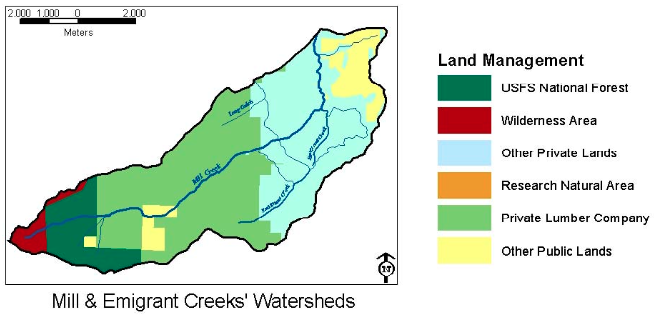
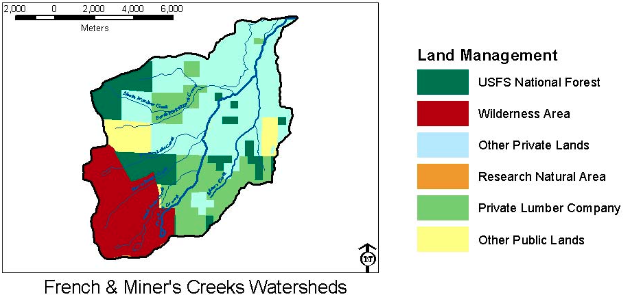
The land surrounding Emigrant creek is entirely under private ownership and land management. Current land use in the lower watershed and in the Quartz Valley is dominated by various types of agriculture including, pasture, ranching, and hay farming. There are several cattle crossings along Emigrant creek as well as a road crossing on Mill creek. In addition, a majority of the land immediately beside the creeks is fenced off to prevent cattle intrusion. Based on conversations with various landowners in the area, historic placer mining occurred on both Mill and Emigrant creeks, but yields were not profitable and the practice was abandoned. Figure 5 is an overview of land use and ownership on Mill and Emigrant creeks.
Mill Creek
Several distinct reach types were delineated along Mill Creek according to channel morphology and vegetation influence. The geomorphology of Mill Creek below the confluence with Emigrant Creek is dominated by alternating riffle-pool sequences interspersed with occasional runs. The lower creek is a perennial system of non-glacial montane and spring-fed origin. There is no evidence of any significant erosional features and generally in-stream sedimentation is low. An extensive, continuous riparian buffer zone extends for more than 5 channel widths on either side of the channel. Riparian vegetation is established and is dominated by alder with some cottonwoods. Moderate willow encroachment into the channel is occurring and slight amounts of rooted emergent aquatic vegetation are present. There is one diversion present along the stream in the form of a cobble jetty/dyke extending into the channel diverting water into a culvert on the right bank. Downstream from the diversion is the fish-screened return operated by a paddle wheel.
Mill creek above the confluence with Emigrant creek is similar, with established riparian vegetation. The left bank has an extensive riparian buffer zone of more than five channel widths; however, on the right bank riparian vegetation is limited due to a rip-rap embankment that follows the channel edge. Several springs provide cold inflow into this part of the creek making it perennial. However, a short distance above the confluence, the input of springs and presence of significant riparian vegetation end. A braided, cobble dominated channel and flood plain opens up and both riparian and instream vegetation disappear completely. Several side and overflow channels exist. Scattered ponderosa pines and dry grasses are present further out past the flood plain. Alternating riffle-run habitats with a mixture of small and large cobble dominates the stream morphology. Pools in this section of Mill Creek were seldom, and occurred generally from scour around vegetation. It should be noted that during the survey period, this portion of Mill creek began to dry up and flows receded upstream. Above the braided section, the character of Mill creek changes again as riparian vegetation returns in the form of herbacious plants with scattered cedars, ponderosa pines and black oaks close to the creek. The uppermost section had flow during the whole sampling period. The habitat is predominately riffle-pool habitat with some LWD present in the channel. The channel system in the upper section is anabranched rather then braided due to the presence of permanent islands between channels with established vegetation.
Emigrant Creek
Near the confluence with Mill creek, Emigrant creek is dominated by alternating pool and run habitats. There is a great deal of LWD in the channel, which creates a variety of plunge and scour pools throughout the lower reaches. This part of the creek is deeply entrenched as seen from the undercut banks. There is continuous established riparian vegetation on either side of the channel as well as a great deal of aquatic vegetation. A large amount of emergent vegetation encroaches into the channel. Further upstream, the channel narrows slightly and heavy riparian vegetation is replaced by a variety of meadow grasses. The presence of a previous beaver dam just below the meadow is evident from an old pond scour line and logjams consisting of drowned cottonwoods. According to J. Menke (personal communication) this dam was washed out in a 1997 flood. The dam created a pond that forced the deposition of organic matter and fine sediments ultimately creating the large open grass meadow that is now present. In this meadow portion of the reach there is a small amount of LWD in the channel and a great deal of rooted emergent and rooted submergent aquatic vegetation. Grasses and herbaceous vegetation surround the creek on either side and a cattle crossing traverses the creek in the meadow. Although grazing occurs periodically in the meadow on the left side of the creek, impacts were not evident.
Slightly upstream from the Emigrant Creek cattle crossing on the right bank is the seasonal outflow of the Baird drain and a bit further a left bank inflow of a cold spring. Another riparian forest begins further upstream from where those two inflows enter the channel. A mix of grasses, alder, hawthorn, and old growth cottonwood line the banks for several channel widths on either side. There are some piles of small woody debris gathered by landowners and piled on the right bank on a small flood plain. Continuing further upstream, channel bank slopes increase significantly and some incision can be seen. Huge cutbanks are present in multiple sites along the reach.
As described above, stream characteristics change drastically from the downstream to upstream ends of the sampling areas in both creeks. This provided the opportunity to survey seven almost completely different sample reaches. From these surveys we were able to observe and assess several factors limiting the relative abundance of juvenile salmonids.
Reach Characteristics
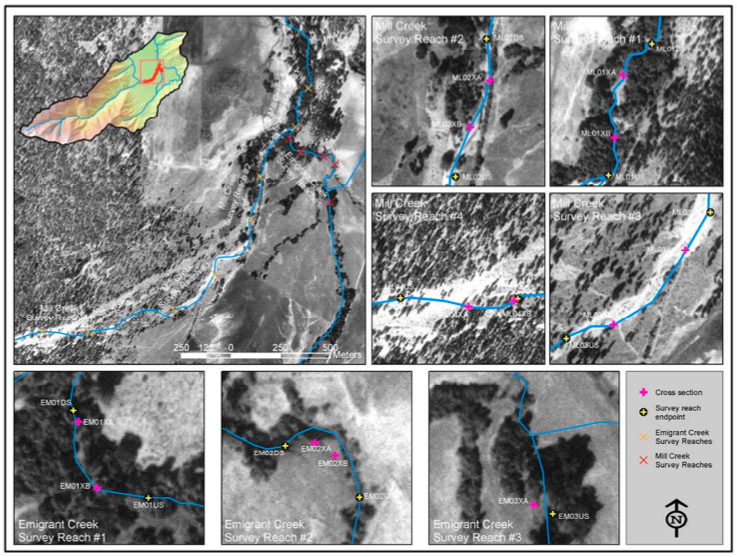
Seven sample reaches were chosen and surveyed along Mill and Emigrant Creeks. These reaches were chosen based on the diversity of channel morphology during stream reconnaissance. A layout of these reaches can be seen in Figure 6. Reach surveys included an assessment of general habitat condition, stream geomorphology, water quality, discharge, substrate condition, macroinvertebrate abundance, and relative fish abundance.
Geomorphology
Four sample reaches on Mill Creek and three reaches on Emigrant Creek were chosen as representative of the types of geomorphic features that may be seen within the Mill Creek watershed (Figure 6). Reach characterization surveys were performed to qualitatively and quantitatively describe the general conditions affecting the morphology of the reach, such as sediment input and vegetative growth. A summary of the geomorphic reach characteristics on Mill and Emigrant Creeks is given in Tables 2 and 3 respectively.
| Reach ID | ML01 | ML02 | ML03 | ML04 |
| Reach Length (m) | 210 | 230 | 315 | 246 |
| Rosgen type | B3 | B3 | D3 | C3 |
| Channel Morphology | single channel | single and multiple | braided | anabranching |
| Geomorphic Units | riffle-pool | riffle-run | riffle-run | riffle-pool |
| Hydraulic Characteristics | ripple/waves | ripple/smooth | ripple/smooth | rippled |
| Surrounding land use | field/pasture | field/pasture | field/pasture | field/pasture |
| Hydrologic Alterations | Diversion | rip-rapped embankment | no evidence | no evidence |
| Degree of instream sedimentation | Low | low | low | none |
| Channel Stability | moderately stable | moderately stable | unstable | moderately unstable |
| Canopy Cover | partly shaded | partly shaded | open | open |
| Dominant riparian species | Alder | willows/alder | absent | herbaceous veg. |
| Vegetation age (yrs) | established (5-30 years) | full range of ages | n/a | immature |
| Slope (%) | 1.17 | 1.37 | 0.35 | 1.89 |
| Width/Depth ratio | 60 | 44 | 55 | 11 |
| Sediment Size XSA D16:D50:D84 (mm) | 11.3 : 36.8 : 73.5 | 19.7 : 45.3 : 104.0 | 14.9 : 45.3 : 104.0 | 22.6 : 59.7 : 128.0 |
| Sediment Size XSB D16:D50:D84 (mm) | 8.0 : 39.4 : 97.0 | 21.1 : 55.7 : 104.0 | 9.8 : 52.0 : 78.8 | 5.3 : 42.2 : 104.0 |
| Reach ID | EMOl | EM02 | EM03 |
| Reach Length (m) | 102 | 107 | 49 |
| Rosoen tvne | F4 | E4 | C4 |
| Channel Mornholo!!V | single channel | single channel | single channel |
| Geomoruhic Units | riffle-oool | riffle-oool | riffle-oool |
| Hydraulic Characteristics |
ripple/smooth | ripple/upwelling | ripple/smooth |
| Surrounding land use | Field/pasture | field/pasture | field/pasture |
| Hydrologic Alterations |
historical beaver oond site |
tail water drain above reach |
no evidence |
| Degree of instream sedimentation |
Low | low | medium |
| Channel Stability | downcutting | stable | moderately unstable |
| Canonv Cover | oartlv shaded | ooen | oartlv shaded |
| Dominant riparian snecies | Grasses | grasses and herbaceous ve11e. | grasses and cottonwoods |
| Vegetation age (yrs) | established (5-30 years) |
established (5-30 years) |
mature |
| Slone (%) | 0.44 | 0.45 | 0.38 |
| Estimated width/ deoth ratio | 30 | 7 | 5 |
| Sediment Size XSA D16:DSO:D84 (mm) | 2.0 : 10.6 : 21.1 | 1.0 :5.3 : 13.0 | 2.8 :8.0 : 21.1 |
| Sediment Size XSB D16:DSO:D84 (mm) | 1.0 : 3.2 : 10.6 | 1.0 : 1.0 : 9.2 | 1.0 :4.3 : 11.3 |
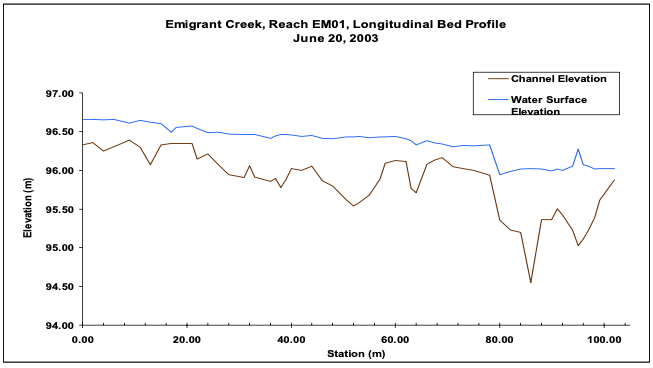
Five of the seven reaches were dominated by alternating riffle-pool sequences interspersed with pools formed by plunge and scour processes due to root wads, emergent vegetation, large woody debris (LWD), or low hanging branches submerged during higher flows. In particular, the lowest segment of Emigrant Creek (EM01) had high quantities of vegetation in and around the channel creating an undulating riffle-pool sequence (Figure 7). There was also at least one case of pool formation due to human activities on Mill Creek (ML03). A small linear stack of larger cobbles and small boulders was placed perpendicular to the flow, crossing the entire width of the channel, and upstream of the stack a pool had been created. In addition, a small, shallow pool had formed immediately downstream of the jetty used to divert some of the water from Mill Creek into a culvert (in ML02).
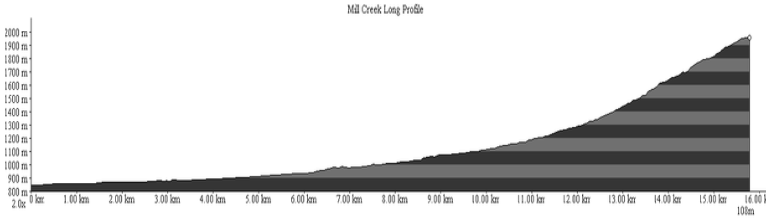
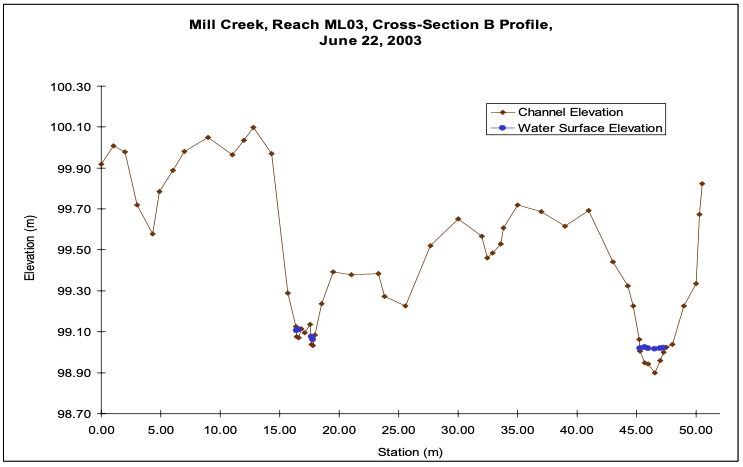
The four reaches on Mill Creek showed a distributary and anabranching pattern in the upstream reach (ML04), with braided and subsurface flow through ML03, followed by converging tributaries in ML02, and finally a more confined single channel type system at the downstream reach, ML01. This pattern reflects the greater geomorphic conditions of the creek as it comes down out of the mountains, crosses an alluvial fan, and enters the Quartz Valley (Figure 8). In ML03, two channels were active during the start of the field surveys, both of which dried up during the course of the study reflecting the cessation of water flowing over at the headwaters of the creek from Mill Creek Ponds (Figure 9).
The upper portion of the Quartz Valley has numerous spring fed tributaries to the Mill Creek watershed. These tributaries provide an outlet for the subsurface flow coming off of the alluvial fans created at the base of the mountains. One of these tributaries can be seen in the reach sketch for ML02, where the tributary ponds up over the left bank before spilling down to join the main stem of Mill Creek (Figure 10). These spring-fed tributaries provide a valuable source of cold water to the creek long after flow from the Mill Creek ponds has ceased.
The major tributary to Mill Creek is the single channel Emigrant Creek whose confluence lies between the Mill Creek study reaches ML01 and ML02. Lower Emigrant Creek is spring fed and has continuous flow year round. All three reaches on Emigrant Creek were dominated by riffle-pool sequences, although ML01 had pools due to LWD and vegetation influences, ML02 had them in an undulating pattern, and ML03 had pools on the outside of meander bends in what is considered the “classic” meandering morphology. In addition, all three reaches had evidence of undercut banks, indicating a certain degree of instability likely due to a change in stream gradient which happened during the 1997 floods when a >2m beaver dam which used to be located in ML01 was blown out. Of these three reaches, only EM03 had a well developed, mature riparian forest and associated shade cover.
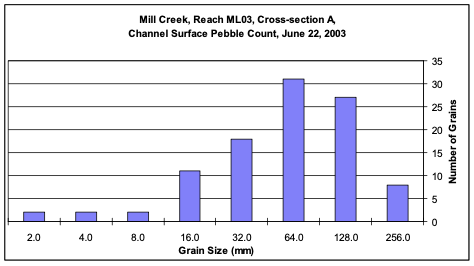
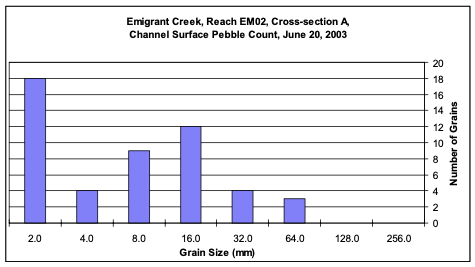
Emigrant Creek surface sediments, sampled during the Wolman pebble count were of a finer nature than those of Mill Creek. Mill Creek was dominated by a mixture of small and large cobbles throughout all morphology types (Figure 11a). Occasional sands and finer grained deposits were found, but mostly adjacent to unstable banks. Emigrant Creek contained a higher percentage of gravels and fines that filled the interstitial space between the cobbles (Figure 11b).
Hydrology
The discharge of each reach was measured using two methods: the velocity-area method, and the float method. Results of these measurements can be seen in Table 4. Due to the disparity between methods as seen from the data, it is hard to make solid conclusions about flows in these reaches. However, speculations and qualitative estimates can be made despite this, remembering that the velocity-area method tends to be more accurate in deeper water, whereas the float method is most accurate in shallow water.
Unfortunately, velocities obtained using float-method data seem to contradict this conclusion. According to these values, flows increase between the uppermost and lowermost reaches on Mill Creek. This makes more sense intuitively and would account for the various influxes along the stream. This contradiction is probably the result of problems with the flow meter and extreme variability in the float method measurements related to date and time of measurement. Although some sections of the creek clearly had reduced flows, no conclusions can be made without further study.
| Site lD | Site Description | Date | Discharge (cms)- velocitv-area method |
Average Discharge (cms)- float method |
| ML01 |
Mill Creek- below Emigrant confluence
|
6/18/03 | 0.303 | 0.875 |
| ML02 |
Mill Creek- riparian corridor above Emigrant confluence
|
6/24/03 | 0.105 | 0.850 |
| ML03 |
Mill Creek- alluvial fan flood plain
|
6/22/03 | 0.021 | 0.070 |
| ML04 |
Mill Creek- just below uppermost Menke property line
|
6/22/03 | 0.326 | 0.1 |
| EM01 |
Emigrant Creek- right above Mill confluence
|
6/19/03 | n/a | 0.450 |
| EM02 |
Emigrant Creek- meadow
|
6/20/03 | n/a | 0.340 |
| EM03 |
Emigrant Creek- riparian forest with old growth cottonwoods
|
6/24/03 | 0.031 | 0.093 |
Electrical conductivity, (EC), and pH were collected at each of the sample reaches with hand-held meters that were placed in the water to obtain quick and accurate readings. pH readings throughout the reaches were similar, close to pH 7, indicating that pH does not impact water quality and that all the reaches are influenced by the same geologic conditions. Collected EC values, however, demonstrate clear differences between Mill and Emigrant creeks. EC readings, which are a measure of salinity, on Emigrant creek were clearly higher than those recorded on Mill creek, (see Table 5). Mill creek EC readings also increased downstream after the Emigrant confluence. This suggests an influence of agriculture runoff or an ag-return drain somewhere on the creek providing an influx of salts to the system.
Water temperature data for the multiple reaches were collected in two different ways. Continuous sampling (15 minute intervals) was completed by thermisters placed in various key points along Mill and Emigrant creeks, and spot measurements were taken by hand with a thermometer at the same time pH and EC measurements were collected.
Point temperature data collected for the different reaches, shown in Table 5, were quite variable due to the fact that readings were taken at different times on different days throughout the survey period. However, the thermister data clearly shows diurnal fluctuations and relationships between temperatures on the upstream and downstream portions of the reach.
| Site ID | Site Description | Time | Date | Temp (°C) | pH | EC (µs) |
| ML01 | Mill Creek- below Emigrant confluence |
12:15pm | 6/ 18/03 | 15 | 7.2 | 70 |
| ML02 | Mill Creek- riparian corridor above Emigrant confluence | 9:20am | 6/24/03 | 13.4 | 6.8 | 67 |
| ML03 | Mill Creek- alluvial fan flood plain |
9:30am | 37794 | 12.5 | 7.4 | 57 |
| ML04 | Mill Creek- just below uppermost Menke property line | n/a | 37794 | 15.4 | 7.2 | 57 |
| EMOl | Emigrant Creek- right above Mill confluence |
8:45am | 6/19/03 | 12.8 | 6.8 | 117 |
| EM02 | Emigrant Creek- meadow | 10:00am | 37792 | 13.8 | 6.7 | 114 |
| EM03 | Emigrant Creek- riparian forest with old growth cottonwoods | 12:55pm | 6/24/03 | 14.7 | 6.7 | 111 |
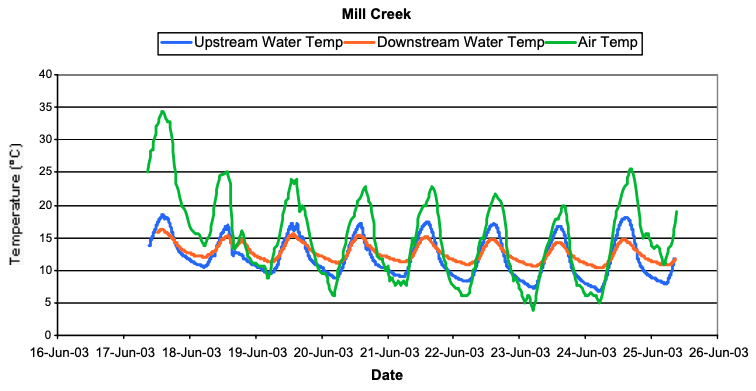
Figure 12 shows the thermister data collected from the furthest upstream and downstream segments of Mill creek, as well as ambient air temperatures from June 17 to June 26. Upstream water temperatures showed larger daily fluctuations with greater maximum and minimum values, while downstream, the range of temperatures was smaller. This difference in temperature ranges is likely due to greater riparian cover in the downstream reaches. In the upstream reaches, with little to no riparian shade, water temperatures were more susceptible to ambient air temperatures. This suggests that during a sustained period of higher ambient air temperatures, such as in mid-summer, the portions of the stream with little canopy cover will likely exhibit higher water temperatures for a sustained period as well. Increased water temperatures can have negative impacts on native salmonids, specifically juvenile coho salmon which typically require that daily maximum temperatures generally remain below 18 ̊C (Moyle 2003).
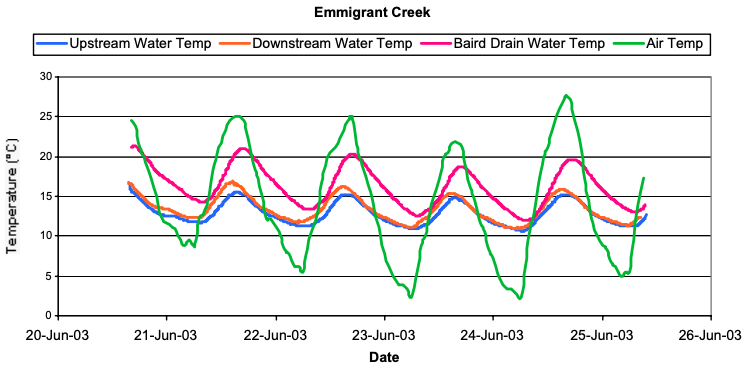
Three additional thermisters were placed around the confluence the Baird drain in Emigrant Creek. One thermister was placed in the Baird drain about 7m upstream from the confluence with Emigrant. The other two were placed on Emigrant Creek, 15m upstream and 15m downstream from the confluence. The data can be seen in Figure 13. The inflow from Baird’s drain is warmer than Emigrant creek and daily maxima at the downstream site seem to be greater than the upstream site. This suggests that the Baird drain plays a role in slightly warming downstream creek temperatures.
Macroinvertebrates
Macroinvertebrates were sampled in each reach in three locations using a kick net. Velocity and temperature was recorded at each sampling site as well as a description of the reach type. Samples were generally taken in fast flowing riffles except for the first sample in ML01, and the second in EM01, which were taken in runs. The third sample in EM03 was taken in a pool. Sampling areas tended to be dominated by cobble along Mill creek, and by gravel on Emigrant creek. One sample on Emigrant creek was taken in sand. Depths for sampling averaged 0.17m, but ranged from 0.05 to 0.4m. The average sampling velocity was 0.3m/s and average temperature was 14.4 °C. Characteristic sampling locations can be seen in the reach sketches shown in Appendix A.
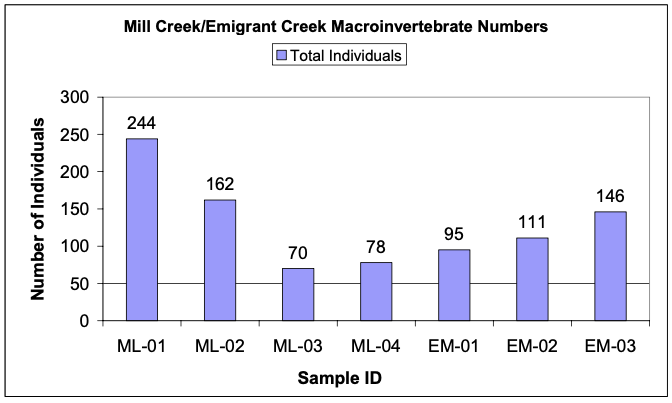
Total numbers of macroinvertebrates per reach on Mill creek decreased in an upstream direction, but increased upstream on Emigrant creek (Figure 14). These opposite trends could be due to the lack of riparian cover in upper Mill creek as well as receding flows during summer. On Emigrant creek this trend was most likely an effect of increased canopy cover and good habitat in the upper reaches.
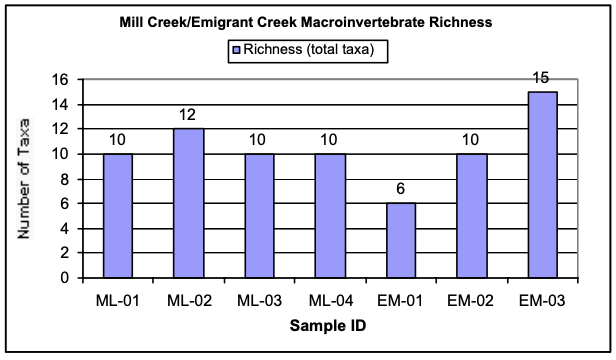
A total of nine different orders were found throughout the two creeks. While there was little variation in the taxa richness of Mill creek, the taxa richness increased in an upstream direction on Emigrant creek (Figure 15). Low variation in substrate content on Mill creek could account for the lack of variation in taxa richness, whereas on Emigrant creek, perhaps the presence of more submerged macrophytes heightened richness by providing more habitat.
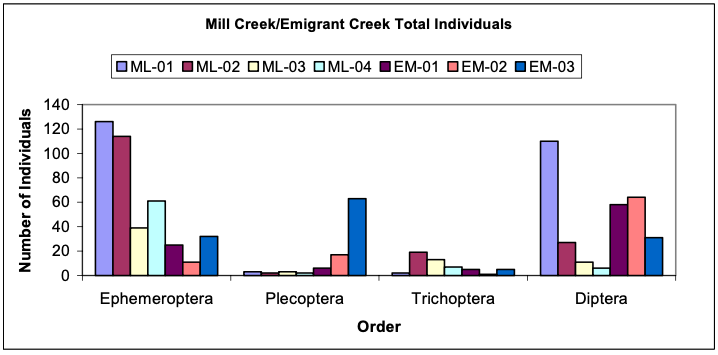
Some important trends to note regarding the EPTD numbers (Figure 16) included a decrease in the number of Ephemeropera and Diptera in the upstream direction on Mill creek but little change in Plecoptera totals. On Emigrant creek there was an increasing trend in Plecoptera numbers upstream as well as large numbers of Diptera throughout the reach. Plecoptera are less tolerant of degraded stream conditions and the greater number of Plecoptera on Emigrant creek suggests a healthier stream. The increase in total individuals in the upstream direction on Emigrant creek can be accounted for by the increase in aquatic vegetation, which provides food. The higher total Ephemeroptera and Diptera levels on Mill creek can be explained by the presence of cobble-dominated substrate which provides better habitat and colonization potential.
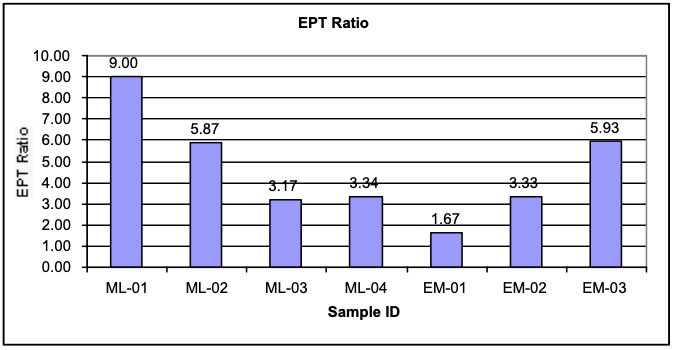
EPT ratios, which can be a good indicator of stream health and total number of species richness, were calculated for each reach and can be seen in Figure 17. A lower EPT ratio generally means a healthier stream. It was found that the EPT ratio for Mill creek decreased moving upstream and increased upstream for Emigrant. From visual observation of the environment together with comparing total individual and taxa numbers, the EPT ratio for both creeks does not reflect actual stream conditions. The EPT ratio on Emigrant creek increased because total numbers of insects on Emigrant increased as well as total number of taxa. Due to this increase in numbers and taxa, upper Emigrant creek was healthier than what is shown with the EPT ratio. With this same reasoning, the lower reaches on Mill creek were healthier than upper Mill creek.
In order to obtain a more complete view of macroinvertebrate diversity, a greater number of sampling methods should be used. Sampling habitat types other than riffles, and employing a greater variety of techniques, such as rock baskets on Emigrant creek, would provide a better assessment of stream conditions.
Fish
Overall, 5 native species were observed in Mill and Emigrant Creeks (Figure 18). The most common anadromous fish observed were juvenile rainbow trout (steelhead, Oncorhynchus mykiss), and they were found in all five reaches surveyed in these watersheds. Juvenile coho salmon were found in both streams, including above the receding diurnal hyporeic flows in Mill Creek in the most upper segment (ML04). In Emigrant Creek, juvenile coho were common and continued to be present far above the upper segment (EM03). The only segment where juvenile coho were not present was in the Mill Creek segment that was drying up (ML03). A lamprey (Tridentata sp.) was also observed in EM02 and speckled dace (Rhincythus osculus) were frequently observed snorkeling in all sampled reaches of Emigrant Creek. A small number of Marbled sculpin (Cottus klamathensis) were observed in the lower segments of Mill Creek (ML01) and Emigrant Creek (EM01 and EM02).
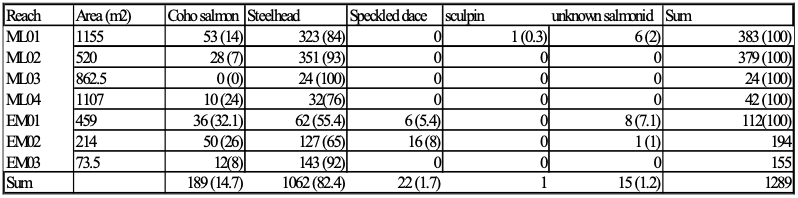
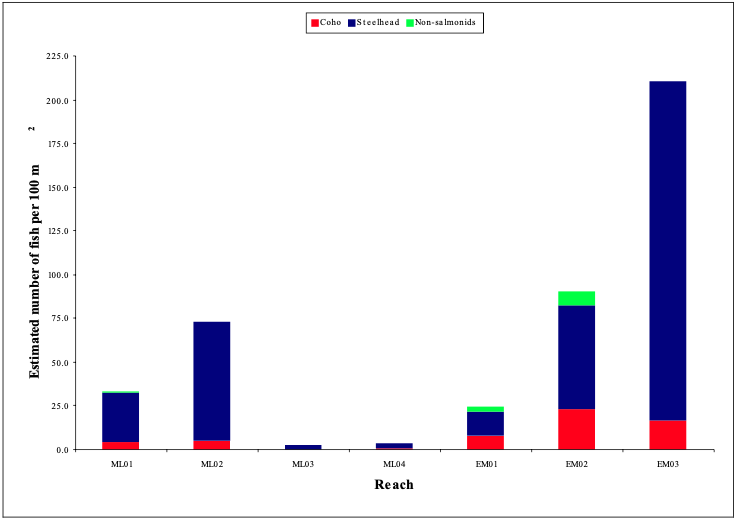
A single surveyor completed all snorkeling in Emigrant and Mill Creeks. Juvenile rainbow trout were the most common fish observed and their numbers decreased in the upper reaches of Mill and Emigrant Creeks. They constituted between 54-100% (Average= 73%) of the fish observed in sample reaches. Juvenile coho were the second most frequently observed fish, and ranged from 0.0-30.0% (Average=16.0%) of the fish sampled within each site. Juvenile coho were not present in ML03, which was drying up during the survey period, although 24 young-of-the-year trout were found in this section. In EM01, juvenile coho were 30.0% of the fish visually observed and this high frequency could be representative of progeny of spawning Mill Creek coho migrating up Emigrant Creek to utilize the cold and productive water in this stream. Although juvenile coho were observed to be a variety of sizes, none were determined to be 1+ size. Other native fish (speckled dace, lamprey, and Marbled sculpin) were uncommon in all sampled reaches. Lamprey were only observed using electrofishing. In EM01 and EM02, speckled dace accounted for 5% and 8%, respectively, of the fish visually surveyed. The reaches with perennial water (EM01-03, ML01, and ML02 contained the highest densities of fish. (Figure 19).
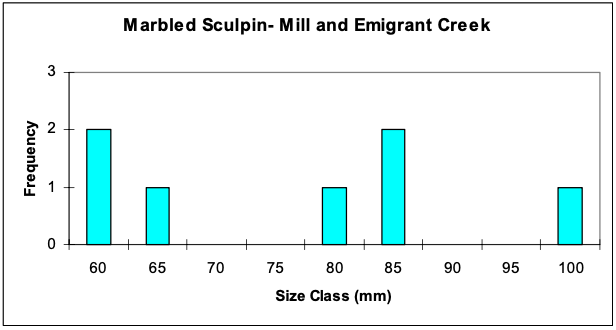
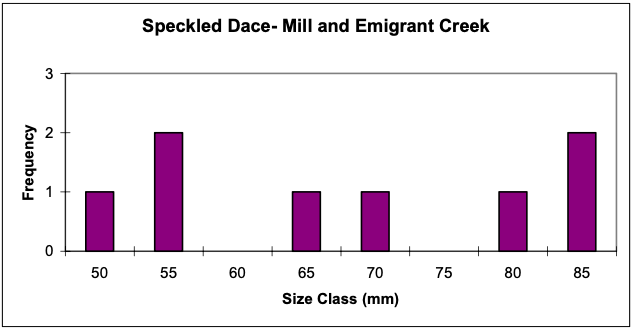
The perennial flows on portions of Mill and Emigrant Creek have allowed the native resident fishes to form multi-age class assemblages. Three size classes of Marbled sculpin and speckled dace were found in Mill and Emigrant Creeks (Figures 20a and 20b).
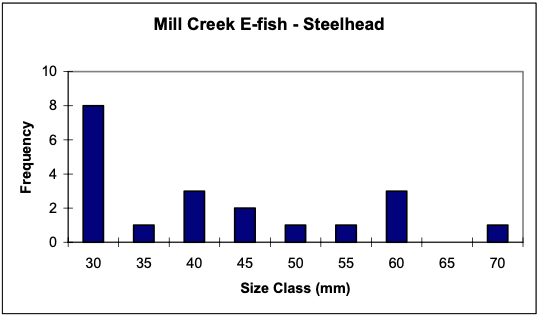
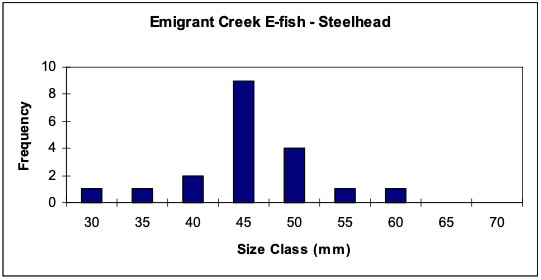
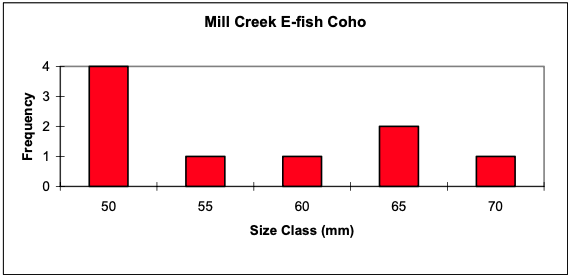
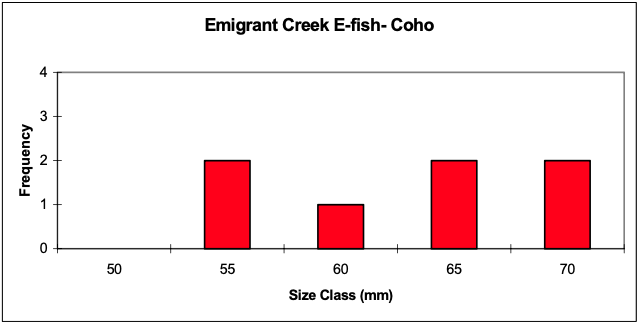
In Mill Creek at least two age classes were observed based on the electrofishing effort, while at least 3 age classes of trout with considerable habitat preferences were observed while snorkeling. Although temperatures were warmer in Mill Creek, a large proportion of juvenile trout electrofished were smaller than those found in Emigrant Creek (Figure 20c and 20d). This may be because smaller fish do not have the swimming ability to make it up into Emigrant Creek, suggesting that the trout found upstream were progeny of Mill Creek spawning steelhead. It is also possible that spawning occurred later in Mill Creek than Emigrant Creek or that habitat conditions in Emigrant Creek are more favorable such that growing rates are simply higher than in Mill Creek. Juvenile coho salmon show a similar relationship in young-of-year size when compared between Emigrant and Mill Creeks (Figure 20e and 20f).
The juvenile rainbow trout were observed in a diversity of habitats. The smallest young-of-year trout were observed in riffle, pool, run, and side channel habitats. In riffles and runs, they were found close to the bottom among the cobbles and along heavily vegetated edges. These microhabitats were likely preferred because they occurred out of the high- velocity flows, allowing for holding and foraging on constant flotsam. In pools, larger young-of-year trout were often found mid-depth just outside the thalweg foraging on drift. Also, smaller trout often occupied the tails of pools against the bottom. Larger 2+ trout were often found in the head of pools. In Mill Creek (ML01 and ML04), it was observed that 2+ fish would take cover among exposed roots, undercut banks, or boulders when the surveyor approached. This behavior was not exhibited juvenile trout in Mill Creek, which did not retreat upon observation. Side channels were used by juvenile trout with preference for those allowing foraging and favorable conditions like those preferred in riffles and runs.
Juvenile coho salmon were not as ubiquitous as rainbow trout and displayed distinct habitat associations. The presence of juvenile coho salmon was dependent on the presence of some form of cover. In reaches that featured pools, juvenile coho primarily occupied slow- moving lateral scour pools, with the depth variable depending on the quantity and quality of cover. Emigrant Creek juvenile coho were found among woody debris in the form of mature willow root wads or undercut banks with exposed roots. Juvenile coho salmon in Emigrant Creek took advantage of deep and shallow slow-velocity pools when cover (large woody debris and root wads) was present. However, in Emigrant Creek juvenile coho were also found in deep-fast pools when cover was not present. In these cases, they preferred swimming along the bottom and foraged up into the thalweg for food. In stream reach segments lacking pools, juvenile coho were found in runs and riffles with higher velocities. In these cases, they were always associated with emerging vegetation or undercut banks along the edges. In Mill Creek, no coho salmon were observed in riffles or runs.
Marbled Sculpin in Mill Creek were observed in small cobbles or gravel on the bottom in fast-flowing riffles and runs. The lamprey in Emigrant Creek was observed in a sand-dominated pool tail. Speckled dace were most abundant in sample reaches containing a large portion of emergent vegetative bank cover, on the bottom of shallow portions of the stream, and out of high-velocity flows. A large number of dace were observed in similar microhabitats as juvenile coho salmon in Emigrant Creek.
FRENCH CREEK
Introduction
The French Creek watershed is bounded on the west by mountains of the Russian Wilderness, where it borders the Marble Mountain Wilderness (Figure 2). The tributaries of French Creek originate within the Russian Wilderness, and wind their way down from the southwestern slopes of the Middle Basin, where they meet and form the main stem of French Creek. French Creek continues in a northeasterly direction through the Scott Valley before it flows into the Scott River a few miles upstream of Etna, California. The headwaters and main stem of French Creek flow through areas of diverse land uses, which include timber harvest, agricultural fields, grazing range, and wild lands. Each land use category affects the stream and its fisheries differently. Land use, combined with the unique geomorphic, hydrologic, and ecological characteristics of French Creek, make the French Creek watershed an important and interesting place to study.
Watershed Characteristics
French Creek is a 3rd order tributary to the Scott River located on the southwest side of the Scott Valley. It flows in a northeast direction, has a total length of 14.8 river km and drains a watershed of 86 km2. The upper watershed exceeds altitudes of 2100 meters, and is located within a wilderness area. The watershed’s lowest point is at an altitude of 850 meters, which is located at the confluence of French Creek with the Scott River. Numerous tributaries in the watershed, when combined with the main stem, total 73.1 stream km with the headwaters of the tributaries located at an altitude of 6000’ to 7000’. The main features of the French Creek Watershed are summarized in Table 6.
| Watershed Area (m2) | 86323400 |
| Watershed Perimeter (m) | 43548 |
| Watershed Aspect | north-northeast |
| Watershed Elevational Range (ft) | 2815 to 7980 |
| Stream Elevational Range (ft) | 2815 to 6605 |
| Emigrant/Miner (ft) | 2925 to 3955 |
| River Distance on Scott (m) | 77296 |
| Stream Order | 3 |
| Emigrant/Miner | 2 |
| Stream Length (m) | 14782 |
| Emigrant/Miner (m) | 7462 |
| Length of all Streams in Watershed | 73102 |
| Drainage Density (m per m2 ) |
0.00085 |
The upper portions of the watershed extend from an approximate elevation of 1200 meters to over 2100 meters, well into a region of decomposing granite and widespread timber operations (Figures 21-22). Abundant erosion within the upper watershed, primarily from logging roads throughout the granitic landscape, is reflected in the relative high levels of in- stream sedimentation of sand sized particles observed throughout the reaches surveyed on French Creek.
Land use
Prior to the 19th century, Native American tribes inhabited the French Creek watershed. Native Americans fished for coho and chinook salmon, lamprey, and other fish for food and trade. In addition, they burned meadows and wetlands for agricultural purposes, and dug intensively for roots in riparian areas.
Early settlers of French Creek focused on farming and ranching, particularly on raising sheep and cattle. As a consequence, large areas were burned and the riparian corridors were deforested in order to convert land to pastures for cattle grazing and cultivation of alfalfa for livestock feed. In addition to draining and damming of riverine wetlands, floodplains and meadows in order to clear the way for crops, diversions were created to redirect water from the creeks to the newly created agricultural fields. Large-scale irrigation and drainage became feasible around 1882 and was accompanied by the construction of numerous flood control projects. By the end of the 19th century, farms and ranches occupied the majority of the land near the lower reaches of French Creek.
In the 1850s, much like surrounding creeks, placer mining became a significant land use along French Creek. Mining continued for many years along French Creek and its tributaries, as piles of tailings along portions of the main stem and Miners Creek attest to today. Mining infrastructure and settlement needs prompted the beginning of commercial logging in the upper watershed in 1869. Logging volume and clearcutting increased dramatically with time, peaking in intensity in 1941. In order to support the logging operations, extensive road networks were cut into the upper watershed hillslopes, which are still in existence today.
Current land use practices are similar to the historic land uses along French Creek. Ranching, farming and timber harvest continue to be the dominant land uses in the French Creek watershed today. The lower reaches of the watershed are almost entirely private property, whereas the upper reaches of the watershed include public wilderness areas as well as private timber production land (Figure 22). Alfalfa fields encompass the majority of the valley section of the watershed, though cattle are free to roam and graze a portion of the creek as well. In addition to crop production and rangeland, current land uses along French Creek include horse ranches, open wild areas, a recreational ranch and private residential property. Although land uses continue to be similar to those in the early 20th Century, land use practices have significantly changed within the watershed. Riparian edges of French Creek have been fenced in order to minimize disturbance from cattle grazing. In addition to fencing, numerous sections of the creek have been restored or allowed to recover on their own. The main channel of French Creek is for the most part, allowed to freely flow and meander. Diversions are generally small and include fish screens and return flows. Active mining is no longer a factor along the creek, with the exception of recreational gold panning along the banks of the streams. However, private and public logging is the dominant land use in the upper watershed of French Creek, where numerous logging roads are present and continue to be used.
Reach Characteristics
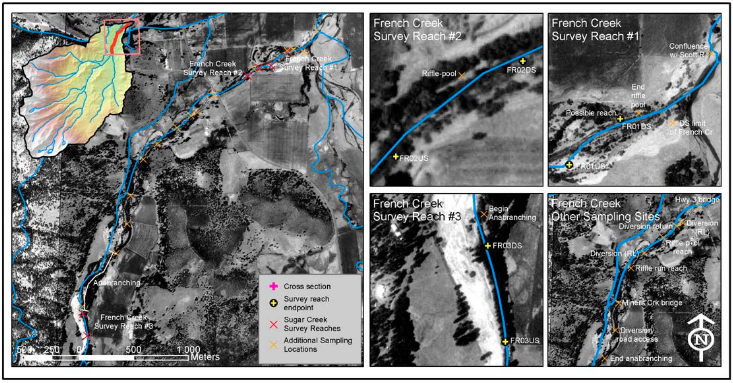
A total of nine reaches within French Creek were characterized and described (Figure 23). These reaches were divided into upper watershed and lower watershed reaches. Four 100 to 200 meter reaches (FR01, FR02a, FR02b, FR03) were surveyed throughout a 4km section of the creek extending upstream from its confluence with the Scott River. In approximate distance from the confluence of French Creek with the Scott River, FR01 is located at 0.7 km, FR02 at 3 km, FR03 at 3.8, and FR04 km. An additional reach survey (FR04) was conducted at an upstream location in a higher gradient section of the creek, approximately 7 km from the confluence. A reconnaissance survey of four upper watershed tributaries (FR05, FR06, FR07, FR08) to French Creek was conducted approximately 10 km to 14 km upstream from the Scott River. These locations were chosen because of their biological and geomorphic relevance.
Geomorphology
The lower surveyed reaches were dominated by repeating riffle-run sequences, with occasional stretches of alternating riffle-pool habitats. Throughout this lower section, the creek was primarily single channel, slightly sinuous, low gradient and dominated by cobble- sized substrate. Approximately 3 km upstream however, the creek changed character and spread out into a multi-channel system for approximately 0.8km. This anabranched section was fairly steep in gradient, dominated by cobble and boulder substrate and contained a variety of step-pool, plunge-pool, riffle and run habitats. The vegetation lining the multiple channels was mature and well-established, providing a significant amount of shade as well as stabilizing the channels into semi-permanent features. Further upstream, the creek returned to a single channel system, but with a higher gradient and coarser substrate than the lowermost reaches near the confluence with the Scott River.
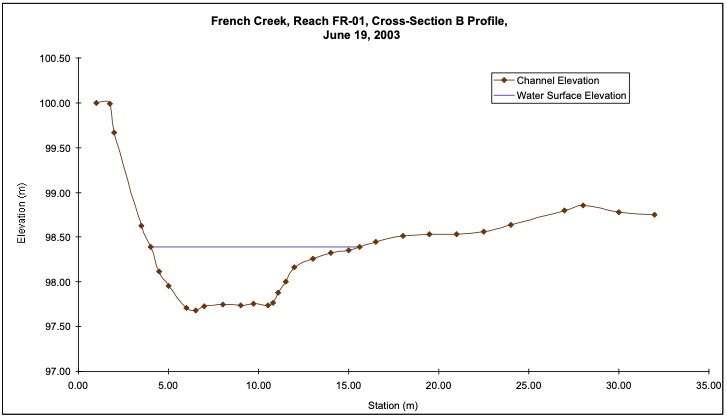
The general habitat associated with each of the various study reaches was very different in nature (Table 7). FR01 was a single channel 200m section of a repeating riffle- pool sequence (Figure 24). Relative to other study reaches, FR01 was characterized by low gradient (0.5%), high amounts of deposited sand (40% of grains), limited spawning gravels (32% of grains) and an extensive floodplain. The pools in this reach were deeper than average and were often associated with scour around large woody debris or root wads. These pools in particular provided good cover for both steelhead and coho salmon.
| French Creek: Reach Type Characteristics | |||||
| ReachID | FR-01 | FR-02a | FR-02b | FR-03 | FR-04 |
| Reach Lenath (ml | 200 | 100 | 100 | 190 | 89.9 |
| Rosaen type | c3 | b3 | d3 | b3 | a2 |
| Channel Morpholoav | sinQle channel | multiple channel | anabranchinQ | sinQle channel | sinqle channel |
| Geomorphic Units | rifle-pool | rifle-run step pool | rifle-run | rifle-run | cascade step-pool |
| Hydraulic Characteristics | H5, H7, H8 | H1,H5, H7 | H5,H6,H7 | H5,H6,H7 | H5,H7,H9 |
| Surroundina land use | QrazinQ | QrazinQ | QrazinQ | orazino | timber. residential |
| Hvdroloaic Alterations | none | none | none | none | none |
| Degree of instream c,:ltliment:iition | hiah | low | medium | medium | medium |
| Channel Stability | moderate | moderate | moderate | stable | moderate |
| Canoov Cover | open | open | shaded | partlv shaded | shaded |
| Dominant riparian species | willow shrubs | willow/alder | alder | alders | conifers |
| Veaetation aae vrsl | immature | immature/established | established | established | mature |
| Slope | 0.5 | 3.2 | 0.08 | 0.5 | 5.5 |
| Estimated width/ deoth ratio | 20 | 25 | 50 | 25 | 23.3 |
| Sediment Size D16:D50:D84(A) | 2.0:36.8:104.0 | 8.6:73.5:152.2 | 2.0:45.3:115.4 | 2.0:8.0:97.0 | 2.0:52.0:194.0 |
| Sediment Size 016:050:084(8) | 2.0:2.0:36.8 | n/a | n/a | 2.0:22.6:104.0 | 2.0:78.8:181.0 |
The remaining reaches were higher gradient with coarser cobble and boulder-sized substrates. FR02a was 100 meters in length and characterized by the confluence of a side channel with the main channel at the end of the 0.8 km anabranching portion of the creek (refer to reach sketches in Appendix B). The main channel was a repeating sequence of riffles and runs, while the side channel contained only a fraction of the discharge and was predominately alternating steps and pools. When compared to the other reaches, FR02a had a relatively high slope (3.2%), contained the highest relative amounts of desirable spawning gravels (56% of all grains) and the lowest observed amounts of sand (14% of all grains).
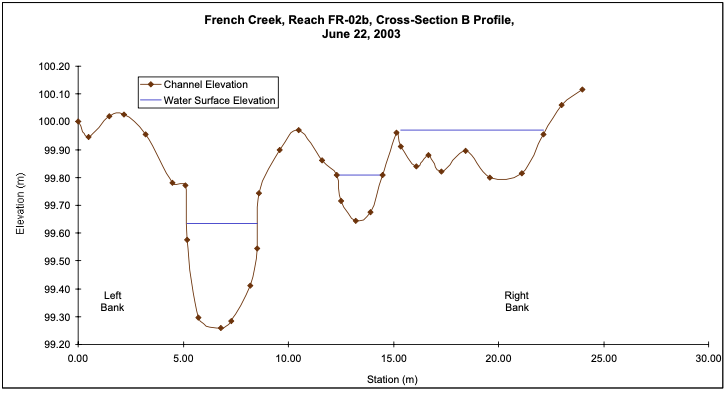
FR02b was located in the upper portion of the anabranched section of the creek and contained multiple channels (Figure 26). In this reach, debris jams and mid-channel islands, stabilized in many cases by large established trees, led to the bifurcation of channels of varying size (refer to reach sketches in Appendix B). The slope was 0.8 % for the entire reach. Similar to FR02a, sand-sized sediment accounted for 19 % of grains and spawning gravels accounted for 49% of grains.
FR03 was a 190-meter section of repeating sequences of riffle-run located just upstream of the anabranched section. Although the slope was similar to FR02b (0.5 %), the flow was confined to a single channel with mixed sand and cobble-sized material (sand accounted for 34% of grains and spawning gravels accounted for 30% of all grains). Also similar to FR02b, but unlike the lower surveyed reaches, FR03 had a well-established riparian zone that, while not extensive beyond the immediate creek banks, provided a significant amount of shade.
FR04 was the most upstream reach that was fully surveyed in detail. Unlike any of the lower reaches, this reach was characterized by a steep gradient (5.5%), very coarse substrate dominated by boulders, cascades and step-pool habitats and an extensive mature riparian zone interspersed with conifers (refer to reach sketch in Appendix B). A fair amount of large woody debris was present in the channel that created scour pools and provided cover for juvenile fish.
Throughout the five lower surveyed reaches on French Creek, a variety of habitats existed that might possibly be conducive to juvenile salmonid rearing; however, the large degree of instream sedimentation, primarily from exposed logging roads in the upper watershed, has degraded the channel substrate in the most of the lower reaches. Sand filled most of the interstitial spaces between cobbles and gravels, and only in the highest gradient reaches where average velocities were greater was there substantial flow through the substrate. The potential effect of these geomorphic characteristics on juvenile salmonids is discussed further in the ‘fish’ section below.
Hydrology
During a normal precipitation year, discharge along French Creek is low during June and continues to decrease into the late summer, when French Creek completely dries out at the confluence of the Scott River (personal communication with landowners). However, the 2003 season was characterized by a particularly unusual hydrologic regime, where significant precipitation occurred in the late spring, causing snow to accumulate in the mountains. These late spring storms caused the Scott Valley and associated tributaries to be wetter and have higher discharges later in the season. The unusual discharge regime significantly impacted the ecological aspects of French Creek.
During the time of study, discharge was estimated at 4 separate stream reaches: FR01, FR02a, FR02b and FR03 (Table 8). Overall, the main channel of French Creek showed downstream increases in discharge as expected. Discharge at FR01 was measured the day after a storm event, which may have increased snowmelt runoff, which in turn would increase the discharge within the main channel on a short-term basis. In addition, increases in discharge in a downstream direction may be accompanied by increases in agricultural return of water into the stream. The upstream riparian vegetation tended to be larger and mature, which could potentially remove water from the main channel via seepage flows and plant uptake. However, a small discrepancy in this increasing downstream trend was observed from FR02b to FR02a. This may have been due to diurnal fluctuations in snowmelt or riparian water uptake, or might simply have been due to surveyor error. Surveyor error might also have been increased due to the numerous boulders and cascades found in these reaches, which disrupt flow velocities further reducing the accuracy of discharge measurements.
| Site ID | Site Description | Date & Time | Discharge (ems)- velocity-area method | Average Discharge (ems)- float method |
| FRO l | French Creek- no coverage, open to direct sunlight | 6/18/03 l:00pm |
3.27 | n/a |
| FR02a | French Creek- no riparian coverage, confluence of Anabranch |
6123103 9:30am |
1.24 | 2.0 |
| FR02b | French Creek- covered anabranch section | 6/23/03 1l:00am |
1.38 | 1.6 |
| FR03 | French Creek- well covered with established riparian vegetation | 6/20/03 1l:00am |
1.05 | n/a |
| FR04 | French Creek- dense established forest coverage | 6/19/03 1l:00am |
0.192 | 0.34 |
| FROS | North Fork French Creek- established riparian area | 6/25/03 l0:00am |
n/a | 1.23 |
| FR06 | Duck Lake Creek- established riparian area | 6/25/03 12:45pm |
n/a | 0.61 |
| FR07 | Paynes Lake Creek - established riparian area | 6/25/03 11:20pm |
n/a | 0.638 |
| FR08 | Horse Range Creek- established riparian area | 6/25/03 11:40am |
n/a | 0.01 |
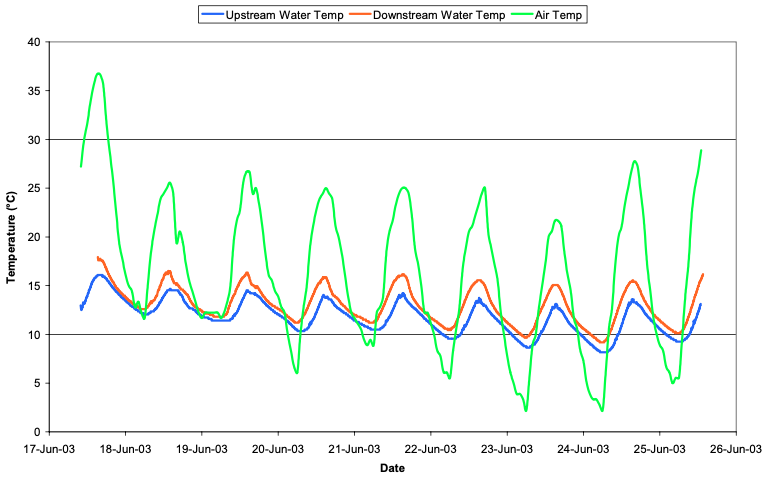
Two temperature loggers were deployed at French Creek, the first at FR01 (31), and the second at FR03 (13). Temperature readings were recorded every 5 minutes from June 17, 2003 to June 25, 2003 (Figure 27). These data demonstrated that FR-03 was colder than FR- 01 by 2oC - 4oC. This cooling effect may have been due to the established riparian vegetation, which shades the reach for most of the day. FR01 was dominated by young riparian species, and had an open main channel that received significant sunlight and provided little shade.
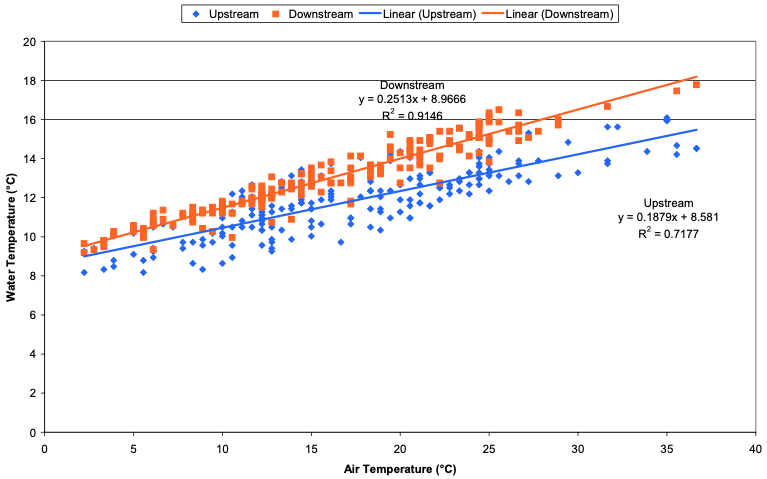
Air and water temperature were strongly and positively correlated (Figure 28). The data show that the downstream reach had a stronger response to air temperature. This may be because it was less shaded by riparian vegetation. As a result, the potential for stream water temperature to increase with increasing air temperatures is high, which can negatively impact coho and steelhead habitat. The upstream reach (FR03) was not as sensitive to changes in temperature, most likely due to the high degree of riparian shading. It is possible that as air temperature increases, this reach may provide thermal refugia for fish during the late summer.
Water quality data collected at each reach is summarized in Table 9. Total dissolved solids (TDS) and electrical conductivity (EC): TDS and EC increased in a downstream direction. TDS may include organic particles, such as leaves and planktonic algae as well as inorganic particles, like sand and silt. Agricultural returns, as well as Miners Creek, may contribute to the overall downstream increase in EC and TDS. However, overall EC reading and TDS readings were indicative of high water quality. pH was constant throughout the system, and did not seem to impact the ecology of French Creek. In addition, numerous epiphytes were observed in the upper reaches of French Creek. Bryophytes (mosses and liverworts) were abundant at FR04, FR05, FR06, FR07 and FR08, indicating high water quality within the upper watershed of French Creek. Overall, French Creek had high water quality, suitable for fish.
| Site ID | Site Description | Time | Date | Temp (c) | PH | TDS (ppm) |
EC (µs) |
| FR0l | French Creek- no coverage, open to direct sunlight | 2:00pm | 6/ 18/03 | 16.3 | 6.26 | 35 | 68 |
| FR02a | French Creek- some riparian coverage, confluence of Anabranch | 1:37pm | 6/22/03 | 12.8 | 6.31 | 28 | 56 |
| FR02b | French Creek- covered anabranch section | 3:50pm | 6/20/03 | 14.0 | 6.28 | 24 | 49 |
| FR03 | French Creek- well covered with established riparian vegetation | 4:00pm | 6/19/03 | 14.4 | 6.27 | 25 | 45 |
| FR04 | French Creek- dense established forest coverage | 2:00pm | 6/24/03 | 10.5 | 6.31 | 15 | 31 |
| FR05 | North Fork French Creek- established riparian area | l0:00am | 6/25/03 | 9.0 | 6.31 | 24 | 11 |
| FR06 | Duck Lake Creek- established riparian area | 12:45pm | 6/25/03 | 10.2 | 6.31 | 9 | 18 |
| FR07 | Paynes Lake Creek - established riparian area | 11:20am | 6/25/03 | 11.l | 6.31 | 8 | 16 |
| FR08 | Horse Range Creek- established riparian area | 11:40am | 6/25/03 | 9.8 | 6.31 | 6 | 13 |
Macroinvertebrates
Macroinvertebrate samples were collected from four lower sample reaches, as well as Miners Creek and three upper watershed reaches. In general, the lower watershed reaches tended to be dominated by riffle-run and riffle-pool geomorphology, whereas the upper reaches tended to be dominated by cascade geomorphology. Invertebrates were collected at 3 sample locations within each reach, with the exception of FR02a and FR02b, where only 2 samples were collected at each anabranch. At these sites, samples were collected from different branches of the channel in order to capture the macroivertebrate distribution variability. Water velocities at the various lower watershed sampling locations ranged from 0.1m/s to 1.4 m/s. The microhabitats sampled at the lower reaches included eight riffles, four runs and one pool, which was sampled at Miners Creek. The substrate sampled was mainly made up of cobbles, gravels, and aquatic macrophytes. Generally, sand was present at high levels in the substrate.
In contrast, the upper watershed sampling locations consisted of four riffles and five cascades, all of which were highly embedded with sand, had higher densities of periphyton and bryophytes, and were characterized by particularly high flow velocities that were difficult to measure due to the complexity of the cascades. Overall, the highest diversity of macroinvertebrates corresponded to reaches with high habitat heterogeneity and reaches where aquatic periphyton and bryophytes were present. Refer to reach sketches in Appendix B for macroinvertebrate sampling sites.
Macroinvertebrate abundance was highly variable throughout French Creek, but certain patterns can be noted. Invertebrate abundance was highest at the lowest and warmest stream reaches (FR01 and FR02) with 121 and 99 individuals per sample respectively (Figure 29). These reaches were also the least shaded reaches and had the most exposure to the sun. An increase in sunlight exposure can translate into higher rates of primary production, which increases the amount of edible algae available to grazing invertebrates. This could benefit fish by increasing prey numbers.
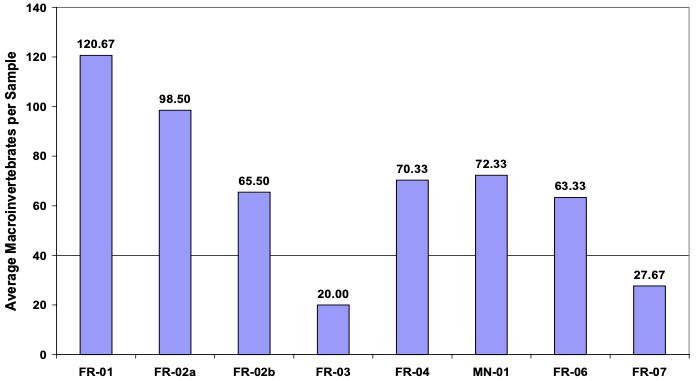
In addition, invertebrate abundance tended to be higher at sites where aquatic autotrophs were abundant; FR01, FR04, and FR06 averaged 121, 70, and 63 individuals per sample respectively (Figure 29). Periphyton and bryophytes were most abundant at the upper watershed reaches, where the dominant geomorphology was cascade (FR04, FR06). Aquatic macrophytes were most abundant in FR01, particularly in the sandy substrate. FR03 was the reach with the lowest macroinvertebrate abundance, only 20 invertebrates per sample. This reach was quite swift, straight and relatively deep with low habitat heterogeneity. FR07 had low macroinvertebrate abundance as well (28 macroinvertebrates per sample). The low abundance of macroinvertebrates in this reach may have been a direct consequence of the habitat characteristics, which was made up of large boulders and the lack of aquatic autotrophs.
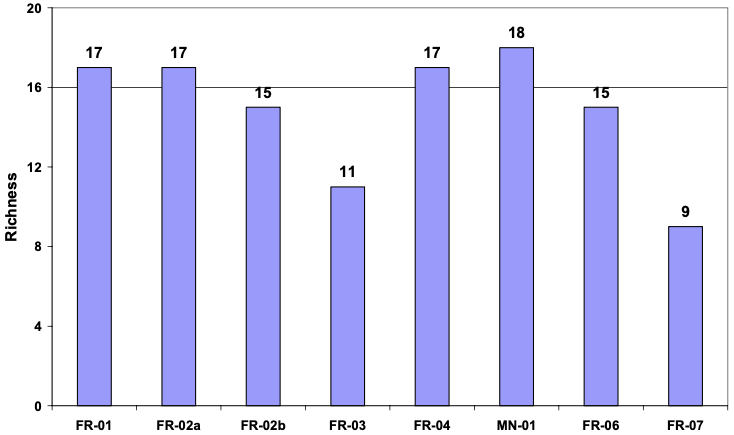
Macroinvertebrate richness did not significantly vary between reaches regardless of location within the watershed (Figure 30). Between 15 and 18 macroinvertebrate taxa were observed at most reaches in French Creek. However, taxa richness did tend to be slightly higher in reach locations that have higher macroinvertebrate abundance. In contrast, two reaches with low richness and abundance stand out; FR07 had the lowest overall taxa richness with only 9 taxa present and FR03 only had 11 taxa. Both of these reaches also had the lowest macroinvertebrate abundance.
cont. pg 44 on pdf
Appendix
A1: Mill & Emigrant Creeks - Reach Pictures
A2: Mill Creek - Data and Charts
A3: Emigrant Creek - Data and Charts
A4: Mill & Emigrant Creeks - Fish Data
A5: Mill & Emigrant Creeks - Macroinvertebrates Data
B1: French Creek - Reach Pictures
B2: French Creek - Data and Charts
B3: French Creek - Fish Data
B4: French Creek - Macroinvertebrates Data
C1: Sugar Creek - Reach Pictures
C2: Sugar Creek - Data and Charts
C3: Sugar Creek - Fish Data
C4: Sugar Creek - Macroinvertebrates Data
D1: East Fork Scott River - Reach Pictures
D2: East Fork Scott River - Data and Charts
D3: East Fork Scott River - Fish Data
D4: East Fork Scott River - Macroinvertebrates Data