The effects of drastic hourly changes in dam releases was first noticed when one of the fish-heads, Brett Baker, discovered several beached juvenile trout on the morning of June 14th at Big Pine campground. Overnight, the stage of the river had fallen approximately six inches, exposing several feet of discolored aquatic vegetation on the beach in front of our campsite. For the next couple days, we continued to observe gage height to be lower in the mornings and higher in the evenings. Further along in our trip, the highs and lows would occur at different times because of the increased time it takes for the water to travel through the system. The high daily water line was easily visible in the plants and sand lining the riverbank. Upon returning home, we learned that releases from the dam were ramped up from 900 to 2000 cfs in the afternoon (Figure 1). These changes in dam releases satisfy heightened power demand in the afternoon due to a rise in air conditioning use. Besides having an effect on juvenile trout, the daily change in flows seemed to have an influence on temperature. On June 17th at river mile 238.6, water temperature was recorded to be 14.87°C at 11:55 AM. On June 18th, at river mile 229.4, temperature was recorded at 19.04°C at 7:20 AM. Why was the temperature on the 18th so much warmer than it was on the 17th? When you think about it, temperature should be much lower at 7:20 AM than at 11:55 AM because the sun has had less time to warm it up. We noticed water levels to be much lower on the morning of the 18th, leading us to conclude that there is a relationship between discharge and temperature. Large discharges are more resistant to heating and cooling because there is simply more mass to heat and cool and because they allow volumes to travel through the system in less time. Smaller volumes are easier to heat because they have less mass and take more time to travel through the system. The observed increase of roughly 4°C can be largely explained by this phenomenon. When setting target temperatures for endangered fish recovery, it seems important to understand how water temperature changes in the system as a result of dam operations.
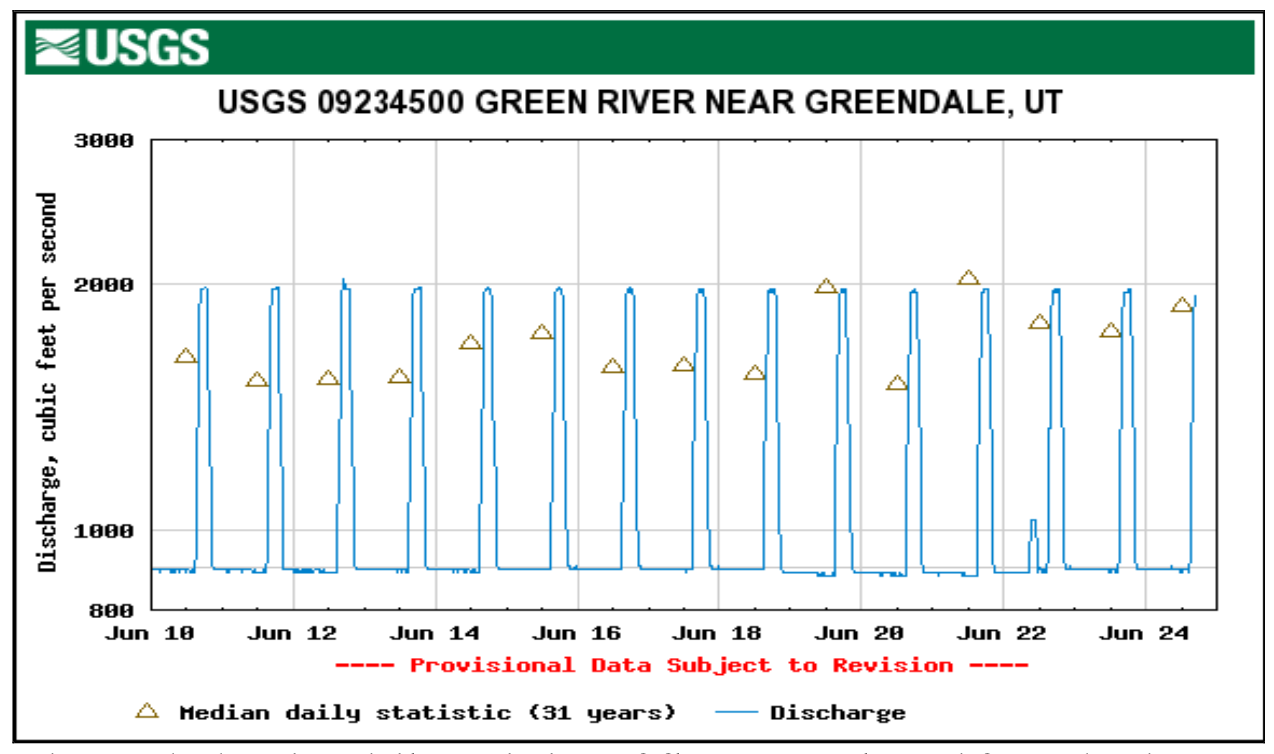
Figure 1. Hydrograph showing daily variation of flowrates released from the dam.