After researching historical land and resource use in the Grande Ronde basin I was quite curious as to what we would see on our trip. Most of the available information on land use in the area is restricted to the upper Grande Ronde basin, where we would not be spending much time. Thus, I felt it was necessary to try to measure something that land use would directly impact, during the course of our trip in the lower Grande Ronde basin. The result of my brainstorming was this: counting large woody debris (LWD) with a clicker while on the river, and then calculating the frequency per mile.
The reason I decided to measure LWD is because in general, land use (especially logging and agriculture) causes a decrease in LWD frequency along the channel. LWD is important to the river ecosystem in that it adds habitat complexity, and fish often depend on shade from the LWD as a source of thermal refuge (Lawson 2007, this volume). In fact, some restoration sites in the headwaters region of the Grande Ronde River, such as Spring Creek, have added LWD to the channel for this very reason.
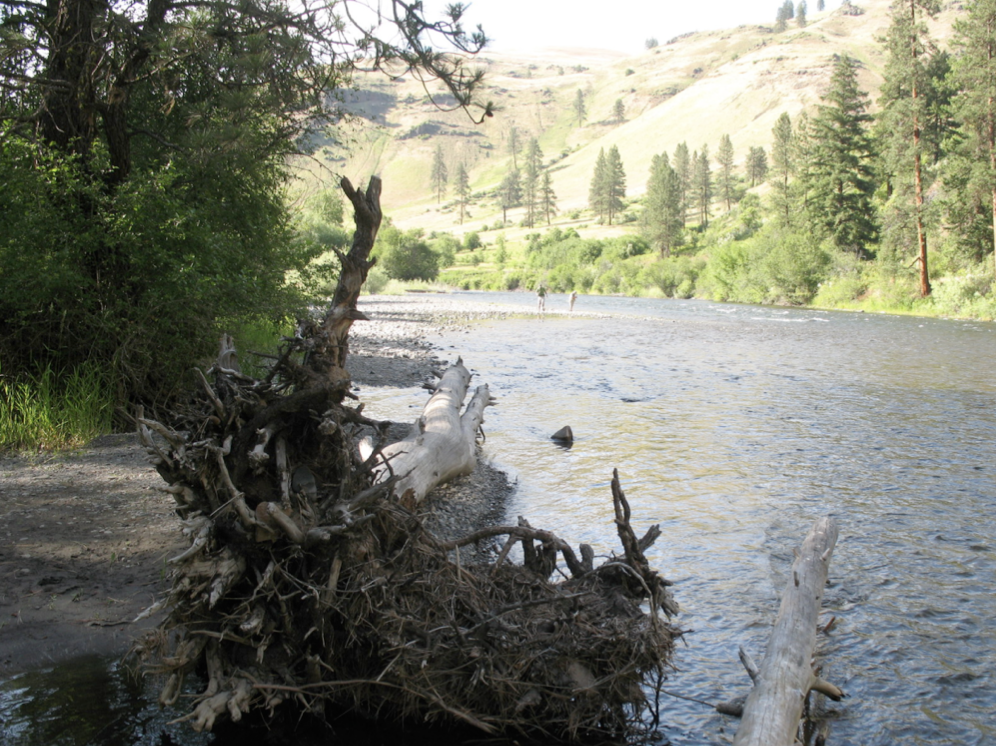
Though LWD is a good parameter to measure the effects of land use, I do realize that the method is inherently subjective, in that one person may define LWD differently than another. I created a set of rules for “counting” LWD. For example, in an aggregation of several logs I counted the clump as one, as opposed to trying to estimate how many logs were in the pile and count them separately. For example, I would have counted the LWD in Figure 1 as a single LWD. Also, I only counted LWD that was actually in the channel or those within two feet of it at about the same elevation, being that river levels were exceptionally low this year. If there was a single log in the channel, I counted it if it was large, and appeared to alter the channel and the habitat complexity (e.g. had a lot of branches sticking out, appeared to alter flow, cast a large shadow on the water, etc.).
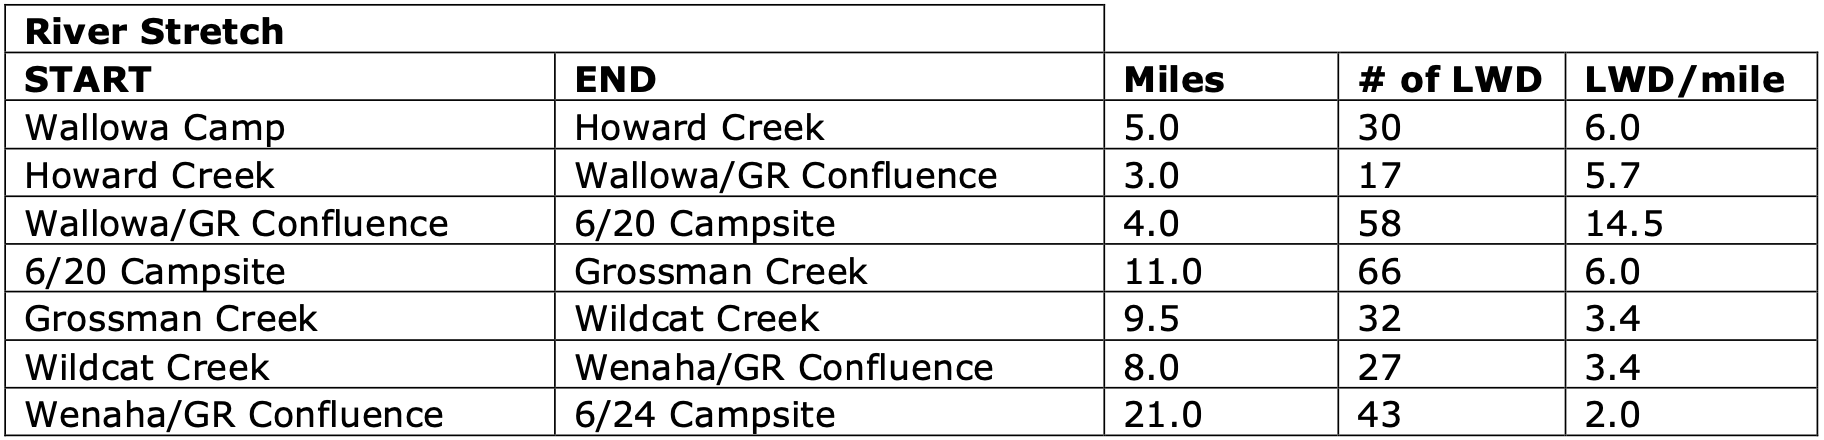
The results from my efforts are depicted below in Figures 2 and 3. As one can see, the LWD frequency per mile along the river is quite low between our initial campsite along the Wallowa River to the confluence with the Grande Ronde. This initial low frequency is not surprising when land use history and patterns are taken into account. Old-growth trees are often susceptible to landslides and other natural events that cause them to end up in the river channel and add habitat complexity. Therefore, the low LWD frequency is most likely due to logging practices (which removed most of the old-growth trees) as well as road and construction (which removed potentially hazardous trees near the road side).
The sudden spike that occurs after the confluence of the Wallowa and Grande Ronde rivers is likely due to the fact that we had entered the designated “Wild and Scenic” portion of the Grande Ronde river. This stretch was fairly unmanaged, with minimal evidence of human impacts, aside from an occasional radio tower or two. From our June 20th campsite, you can see that LWD frequency begins to decline from there. This is due to several reasons. For one, land use began to become more prevalent, especially when we hit more urban areas, such as Troy, and began to see more grazing practices in the lower reaches. The other reason was that the hillside gradient got steeper and steeper as we entered the canyon area near the confluence with the Snake River, therefore, less trees were able to grow on such an extreme slope.
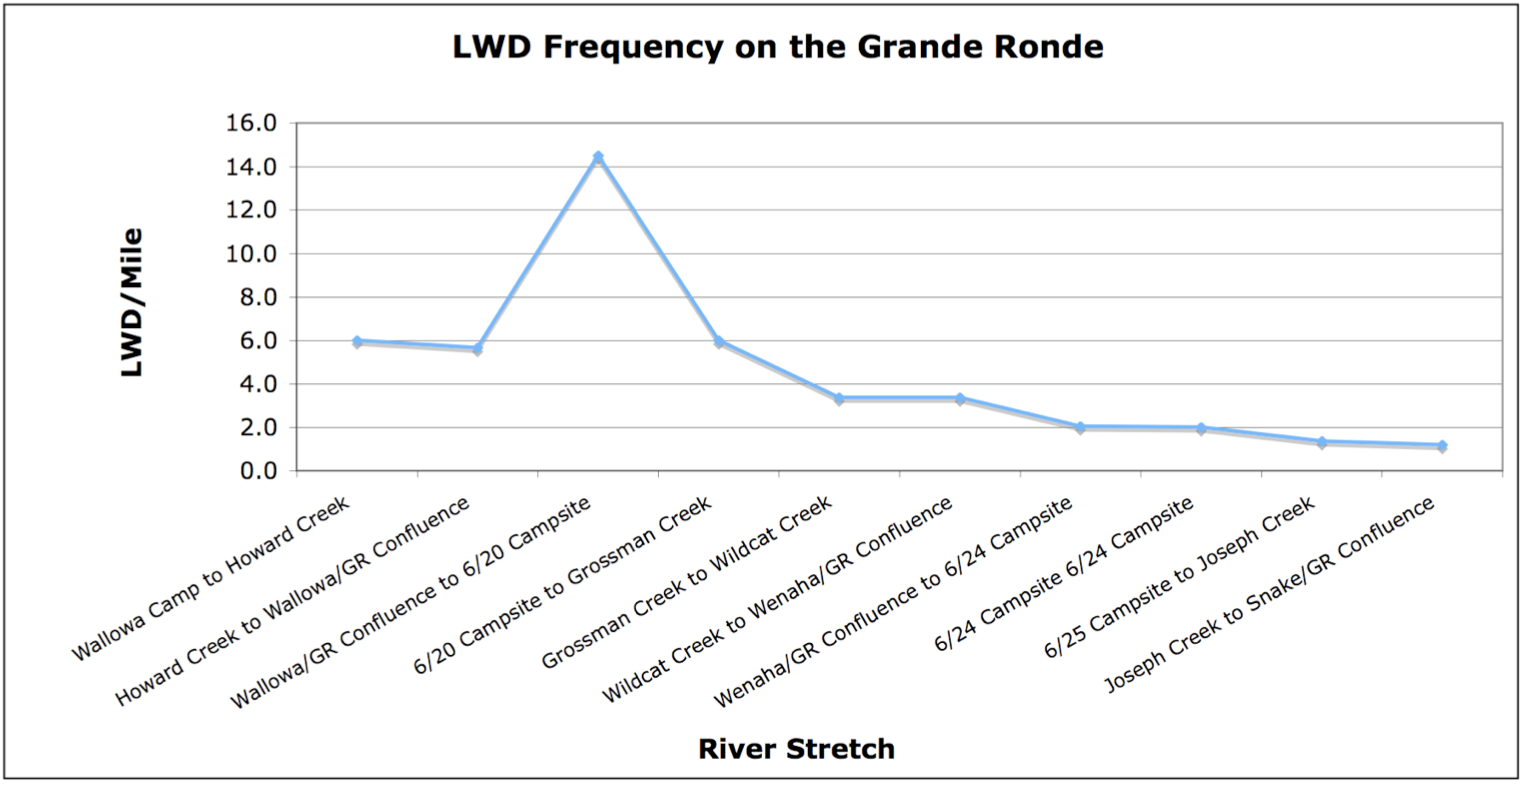

As I wrap up this incredibly long flog, I would like to stress a few points. In Vannote et al.’s (1980) River Continuum Concept, there should be a gradient in the downstream direction from coarse particulate organic matter (CPOM) to fine particulate organic matter (FPOM). Judging from the above graph, it looks like the LWD (which is considered CPOM) frequency actually fits pretty well, with land use (or the lack of it) showing a fairly large impact in the downstream gradient. However, these preliminary “results” must be taken with a grain of salt given the casual nature of the study.